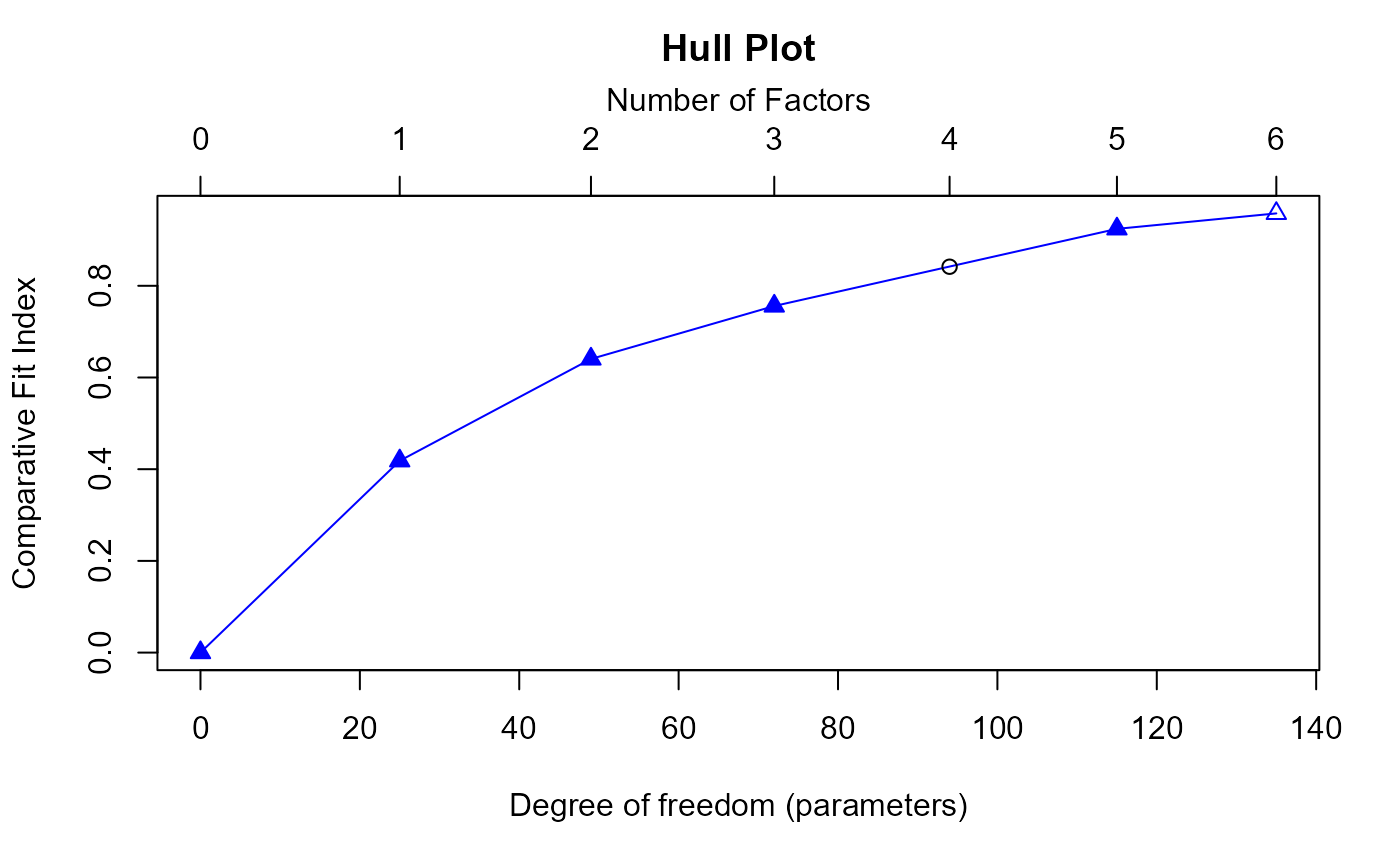
the Hull Approach
Hull.RdThe Hull method is a heuristic approach used to determine the optimal number of common factors in factor analysis. It evaluates models with increasing numbers of factors and uses goodness-of-fit indices relative to the model degrees of freedom to select the best-fitting model. The method is known for its effectiveness and reliability compared to other methods like the scree plot.
Hull(
  response,
  fa = "pc",
  nfact = 1,
  cor.type = "pearson",
  use = "pairwise.complete.obs",
  vis = TRUE,
  plot = TRUE
)
Arguments
- response
A required
N×Imatrix or data.frame consisting of the responses ofNindividuals toIitems.- fa
A string that determines the method used to obtain eigenvalues in PA. If
"pc", it represents Principal Component Analysis (PCA); if"fa", it represents Principal Axis Factoring (a widely used Factor Analysis method; @seealsofactor.analysis; Auerswald & Moshagen, 2019). (Default ="pc")- nfact
A numeric value that specifies the number of factors to extract, only effective when
fa = 'fa'. (Default = 1)- cor.type
A character string indicating which correlation coefficient (or covariance) is to be computed. One of
"pearson"(default),"kendall", or"spearman". @seealsocor.- use
an optional character string giving a method for computing covariances in the presence of missing values. This must be one of the strings
"everything","all.obs","complete.obs","na.or.complete", or"pairwise.complete.obs"(default). @seealsocor.- vis
A Boolean variable that will print the factor retention results when set to
TRUE, and will not print when set toFALSE. (default =TRUE)- plot
A Boolean variable that will print the Hull plot when set to
TRUE, and will not print it when set toFALSE. @seealsoplot.Hull. (Default =TRUE)
Value
A list with the following components:
- nfact
The optimal number of factors according to the Hull method.
- CFI
A numeric vector of CFI values for each number of factors considered.
- df
A numeric vector of model degrees of freedom for each number of factors considered.
- Hull.CFI
A numeric vector of CFI values with points below the convex Hull curve removed.
- Hull.df
A numeric vector of model degrees of freedom with points below the convex Hull curve removed.
Details
The Hull method (Lorenzo-Seva & Timmerman, 2011) is a heuristic approach used to determ ine the number of common factors in factor analysis. This method is similar to non-graphical variants of Cattell's scree plot but relies on goodness-of-fit indices relative to the model degrees of freedom. The Hull method finds the optimal number of factors by following these steps:
Calculate the goodness-of-fit index (CFI) and model degrees of freedom (df; Lorenzo-Seva & Timmerman, 2011; \(df = I × F - 0.5 × F * (F - 1)\), \(I\) is the number of items, and \(F\) is the number of factors) for models with an increasing number of factors, up to a prespecified maximum, which is equal to the
nfact of
PAmethod. the GOF will always be Comparative Fit Index (CFI), for it performs best under various conditions than other GOF (Auerswald & Moshagen, 2019; Lorenzo-Seva & Timmerman, 2011), such as RMSEA and SRMR. @seealsoEFAindexIdentify and exclude solutions that are less complex (with fewer factors) but have a higher fit index.
Further exclude solutions if their fit indices fall below the line connecting adjacent viable solutions.
Determine the number of factors where the ratio of the difference in goodness-of-fit indices to the difference in degrees of freedom is maximized.
References
Auerswald, M., & Moshagen, M. (2019). How to determine the number of factors to retain in exploratory factor analysis: A comparison of extraction methods under realistic conditions. Psychological methods, 24(4), 468-491. https://doi.org/https://doi.org/10.1037/met0000200.
Lorenzo-Seva, U., Timmerman, M. E., & Kiers, H. A. L. (2011). The Hull Method for Selecting the Number of Common Factors. Multivariate Behavioral Research, 46(2), 340-364. https://doi.org/10.1080/00273171.2011.564527.
Examples
library(EFAfactors)
set.seed(123)

##Take the data.bfi dataset as an example.
data(data.bfi)

response <- as.matrix(data.bfi[, 1:25]) ## loading data
response <- na.omit(response) ## Remove samples with NA/missing values

## Transform the scores of reverse-scored items to normal scoring
response[, c(1, 9, 10, 11, 12, 22, 25)] <- 6 - response[, c(1, 9, 10, 11, 12, 22, 25)] + 1


## Run EKC function with default parameters.
# \donttest{
Hull.obj <- Hull(response)
#> The number of factors suggested by Hull is 5 .


print(Hull.obj)
#> The number of factors suggested by Hull is 5 .

plot(Hull.obj)

## Get the CFI, df and  nfact results.
CFI <- Hull.obj$CFI
df <- Hull.obj$df
nfact <- Hull.obj$nfact

print(CFI)
#> [1] 0.0000000 0.4182784 0.6403758 0.7558834 0.8416003 0.9241558 0.9578829
print(df)
#> [1]   0  25  49  72  94 115 135
print(nfact)
#> [1] 5

# }