Plot Voting Results for Number of Factors
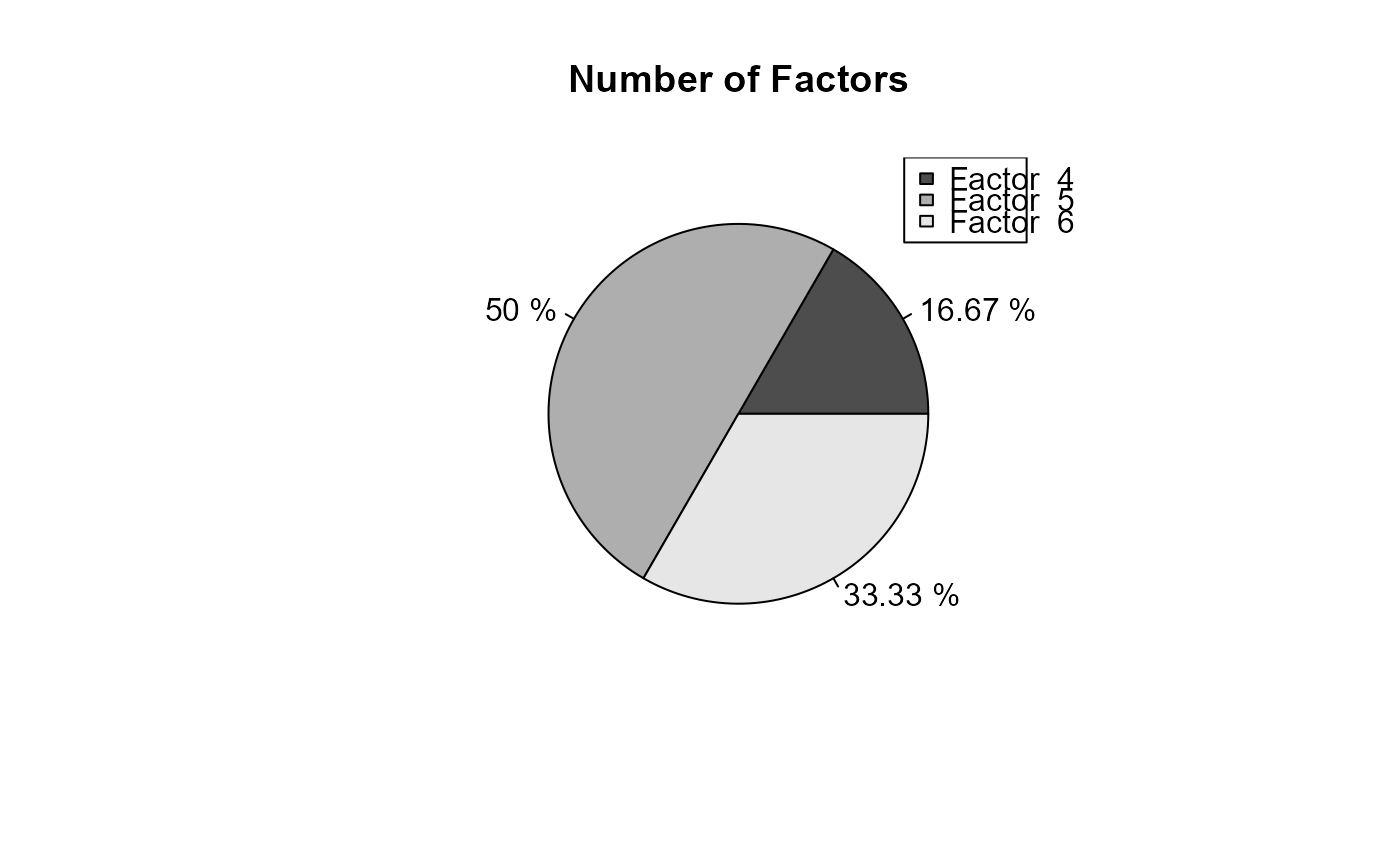
plot.EFAvote.RdThis function creates a pie chart to visualize the results of a voting method used to determine the number of factors in exploratory factor analysis (EFA). The voting method combines the results from multiple EFA techniques, and the pie chart displays the proportions of votes each number of factors received. Each slice of the pie represents the percentage of votes for a specific number of factors, providing a clear visual representation of the most commonly suggested number of factors.
# S3 method for class 'EFAvote'
plot(x, ...)
Arguments
Value
None. This function is used for side effects (plotting).
