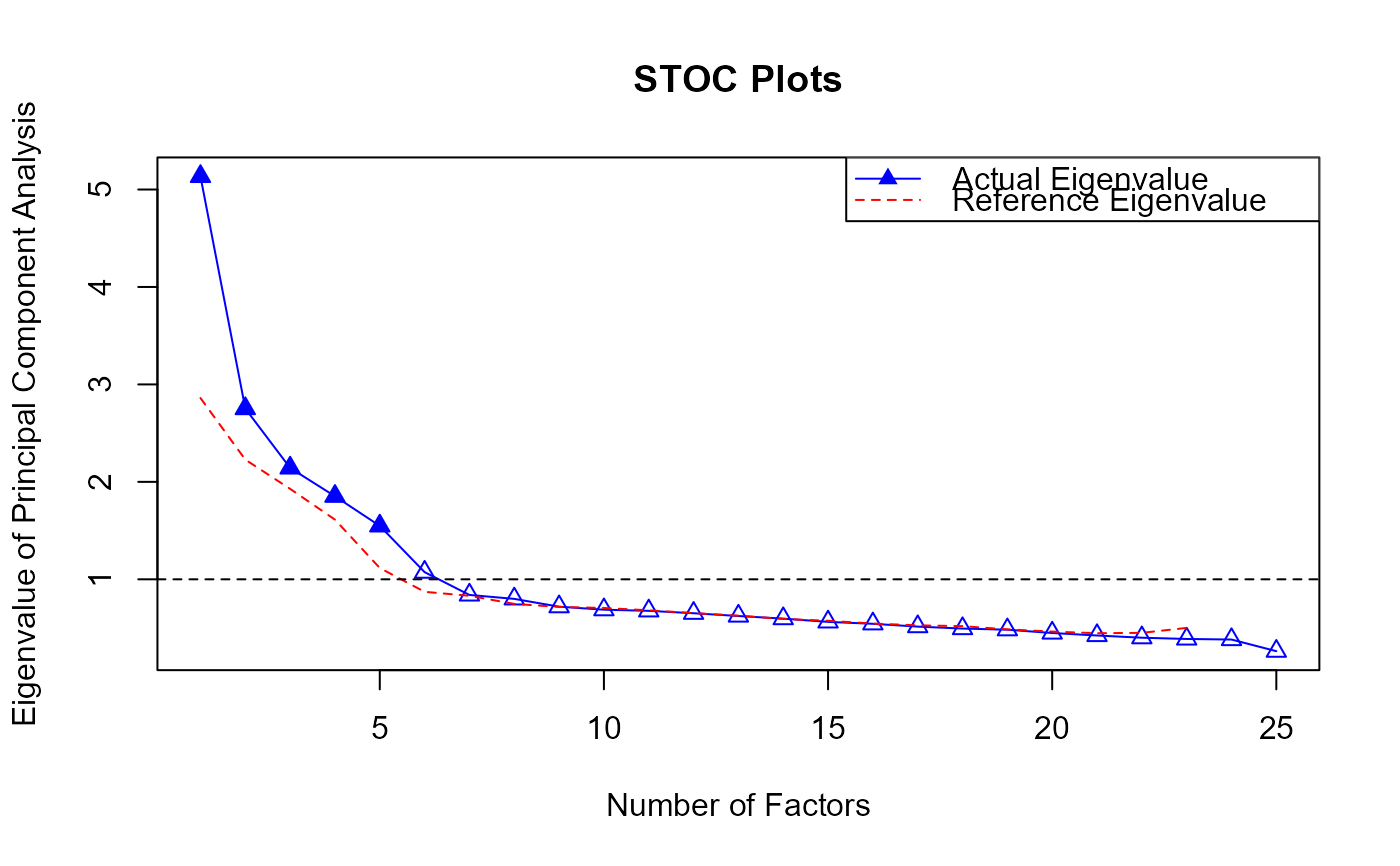
Scree Test Optimal Coordinate (STOC)
STOC.RdThe STOC (Raiche et al., 2013) approach is based on fitting \(I-2\) (\(I\) is the number of observed variables) two point regression models using the (i+1)th and I-th (the last one) eigenvalue to obtain a prediction for the i-th eigenvalue that is referred to as optimal coordinate (with p being the number of observed variables and therefore also the number of eigenvalues). If the observed empirical eigenvalue is larger than the predicted optimal coordinate. Raiche et al. (2013) also argue for a restricted version that retains only factors with an eigenvalue greater than the reference eigenvalue by PA (holds PCA and quant=0.95 in this package).
STOC(
  response,
  fa = "pc",
  nfact = 1,
  cor.type = "pearson",
  use = "pairwise.complete.obs",
  vis = TRUE,
  plot = TRUE
)
Arguments
- response
A required
N×Imatrix or data.frame consisting of the responses ofNindividuals toIitems.- fa
A string that determines the method used to obtain eigenvalues in PA. If
"pc", it represents Principal Component Analysis (PCA); if"fa", it represents Principal Axis Factoring (a widely used Factor Analysis method; @seealsofactor.analysis; Auerswald & Moshagen, 2019). (Default ="pc")- nfact
A numeric value that specifies the number of factors to extract, only effective when
fa = 'fa'. (Default = 1)- cor.type
A character string indicating which correlation coefficient (or covariance) is to be computed. One of
"pearson"(default),"kendall", or"spearman". @seealsocor.- use
an optional character string giving a method for computing covariances in the presence of missing values. This must be one of the strings
"everything","all.obs","complete.obs","na.or.complete", or"pairwise.complete.obs"(default). @seealsocor.- vis
A Boolean variable that will print the factor retention results when set to
TRUE, and will not print when set toFALSE. (default =TRUE)- plot
A Boolean variable that will print the STOC plot when set to
TRUE, and will not print it when set toFALSE. @seealsoplot.STOC. (Default =TRUE)
Value
An object of class STOC, which is a list containing the following components:
- nfact
The number of factors to retain by both Optimal Coordinate and PA.
- nfact.STOC
The number of factors to retain only by Optimal Coordinate.
- nfact.PA
The number of factors to retain only by PA.
- fa
Indicates the method used to obtain eigenvalues. 'pc' represents Principal Component Analysis, and 'fa' represents Principal Axis Factoring.
- eigen.value
A vector containing the empirical eigenvalues.
- eigen.ref
A vector containing the reference eigenvalues by both Optimal Coordinate and PA.
References
Raiche, G., Walls, T. A., Magis, D., Riopel, M., & Blais, J.-G. (2013). Non-graphical solutions for Cattell's scree test. Methodology, 9(1), 23-29. https://doi.org/10.1027/1614-2241/a000051
Goretzko, D. (2025). How many factors to retain in exploratory factor analysis? A critical overview of factor retention methods. Psychological methods, Advance online publication. https://doi.org/10.1037/met0000733
See also
STOC
Examples
library(EFAfactors)
set.seed(123)

##Take the data.bfi dataset as an example.
data(data.bfi)

response <- as.matrix(data.bfi[, 1:25]) ## loading data
response <- na.omit(response) ## Remove samples with NA/missing values

## Transform the scores of reverse-scored items to normal scoring
response[, c(1, 9, 10, 11, 12, 22, 25)] <- 6 - response[, c(1, 9, 10, 11, 12, 22, 25)] + 1

# \donttest{
 STOC.obj <- STOC(response, plot=FALSE)
#> The number of factors suggested by STOC is 5 .

 ## STOC plot
 plot(STOC.obj)


# }
# }