Minimum Average Partial (MAP) Test
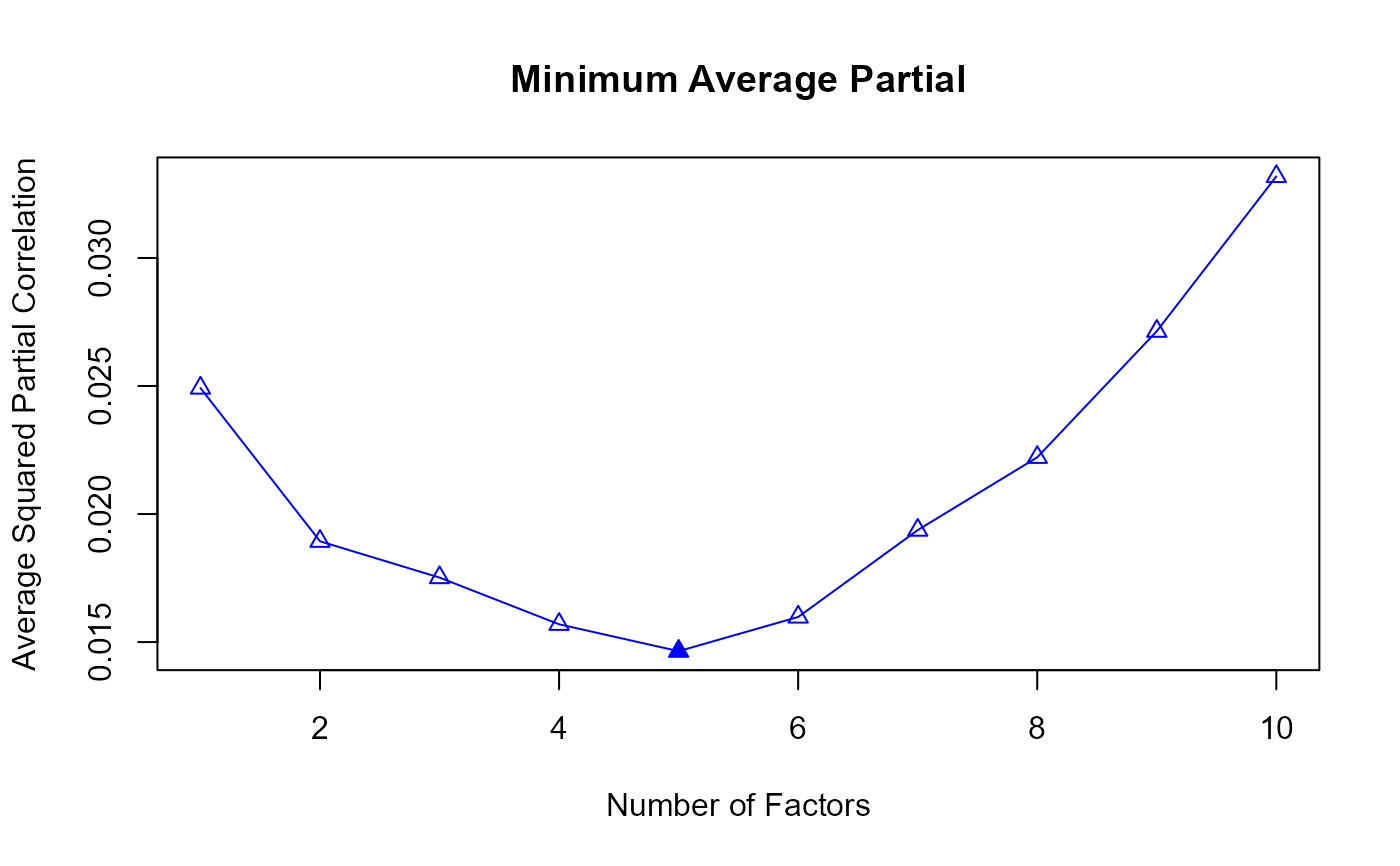
MAP.RdThe MAP test by Velicer (1976)was originally designed for determining the number of components in PCA but is used in EFA as well. At it score, the averaged partial correlations after excluding the variance that can be explained by the previous components are compared among different solutions and the one with the smallest value is chosen (therefore, MAP test).
MAP(
  response,
  fa = "pc",
  nfact.max = 10,
  cor.type = "pearson",
  use = "pairwise.complete.obs",
  vis = TRUE,
  plot = TRUE
)
Arguments
- response
A required
N×Imatrix or data.frame consisting of the responses ofNindividuals toIitems.- fa
A string that determines the method used to obtain factors loadings. If
"pc", it represents Principal Component Analysis (PCA); if"fa", it represents Maximun Likelihhod Estimation (a widely used Factor Analysis method; @seealsofa; Auerswald & Moshagen, 2019). (Default ="pc")- nfact.max
The maximum number of factors discussed by MAP. (default = 10)
- cor.type
A character string indicating which correlation coefficient (or covariance) is to be computed. One of
"pearson"(default),"kendall", or"spearman". @seealsocor.- use
an optional character string giving a method for computing covariances in the presence of missing values. This must be one of the strings
"everything","all.obs","complete.obs","na.or.complete", or"pairwise.complete.obs"(default). @seealsocor.- vis
A Boolean variable that will print the factor retention results when set to
TRUE, and will not print when set toFALSE. (default =TRUE)- plot
A Boolean variable that will print the MAP plot when set to
TRUE, and will not print it when set toFALSE. @seealsoplot.MAP. (Default =TRUE)
Value
An object of class MAP, which is a list containing the following components:
- nfact
The number of factors to retain by both Optimal Coordinate and PA.
- MAP.values
the averaged squared partial correlations for 1 to
nfact.maxfactors.
References
Velicer, W. F. (1976). Determining the number of components from the matrix of partial correlations. Psychometrika, 41(3), 321–327. https://doi.org/10.1007/BF02293557
Goretzko, D. (2025). How many factors to retain in exploratory factor analysis? A critical overview of factor retention methods. Psychological methods, Advance online publication. https://doi.org/10.1037/met0000733
See also
MAP
Examples
library(EFAfactors)
set.seed(123)

##Take the data.bfi dataset as an example.
data(data.bfi)

response <- as.matrix(data.bfi[, 1:25]) ## loading data
response <- na.omit(response) ## Remove samples with NA/missing values

## Transform the scores of reverse-scored items to normal scoring
response[, c(1, 9, 10, 11, 12, 22, 25)] <- 6 - response[, c(1, 9, 10, 11, 12, 22, 25)] + 1

# \donttest{
 MAP.obj <- MAP(response, plot=FALSE)
#> The number of factors suggested by MAP is 5 .

 ## MAP plot
 plot(MAP.obj)


# }
# }