Plot Method for sim.data Objects
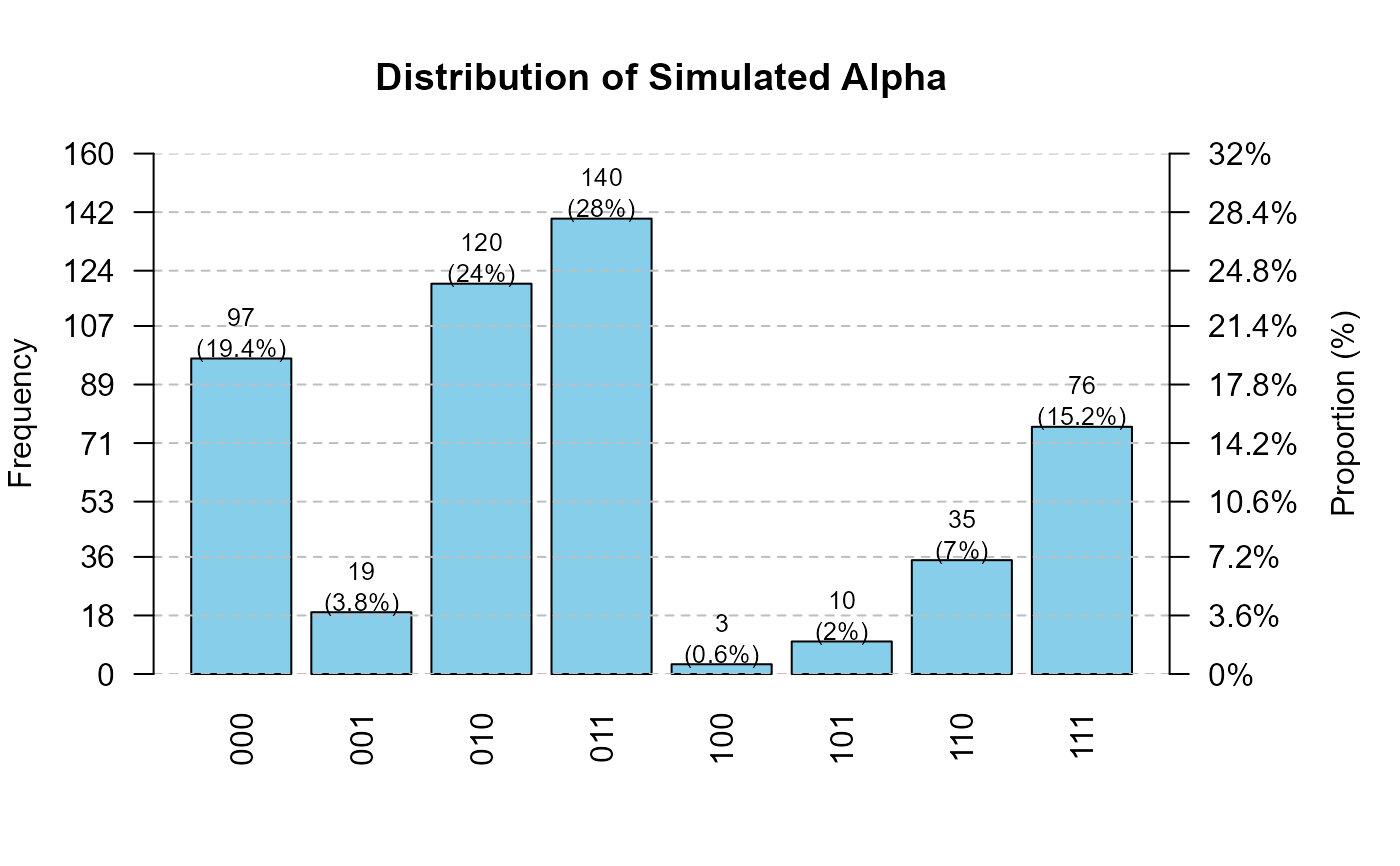
plot.sim.data.RdThis function generates a bar plot visualizing the distribution of \(\boldsymbol{\alpha}\). The plot includes both the frequency and proportion (percentage) of each pattern. Frequencies are displayed as bars, and proportions are annotated both above the bars and as a secondary axis on the right.
# S3 method for class 'sim.data'
plot(x, ...)
Arguments
- x
An object of class
sim.data, typically returned bysim.datafunction.- ...
Additional arguments (currently unused).
Value
None. This function is used for side effects (plotting).
Examples
set.seed(123)
library(Qval)

Q <- sim.Q(3, 20)
IQ <- list(
  P0 = runif(20, 0.0, 0.2),
  P1 = runif(20, 0.8, 1.0)
)
data.obj <- sim.data(Q = Q, N = 500, IQ = IQ,
                     model = "GDINA", distribute = "horder")
#> distribute =  horder
#>  model =  GDINA
#>  number of attributes:  3
#>  number of items:  20
#>  num of examinees:  500
#>  average of P0 =  0.083
#>  average of P1 =  0.894
#> theta_mean =  -0.055 , theta_sd = 0.996
#>  a =  1.5 1.5 1.5
#>  b =  -1.5 1.5 0
plot(data.obj)